Description
See the problem. Understand the cause.
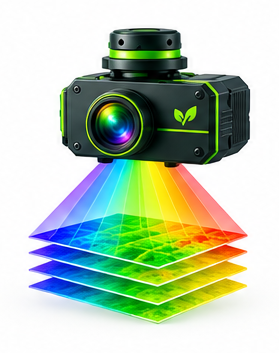
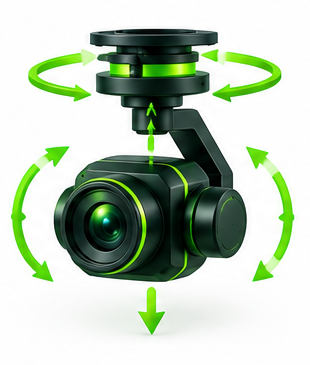
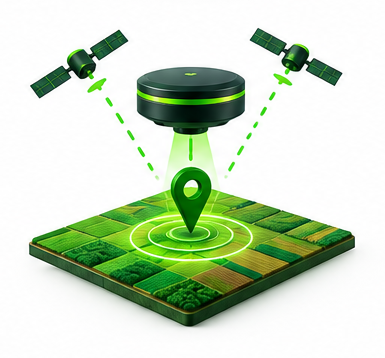
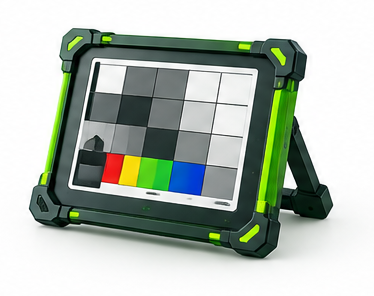
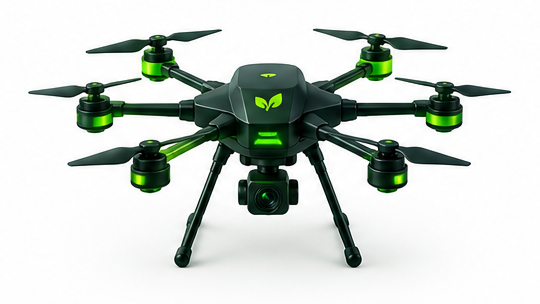
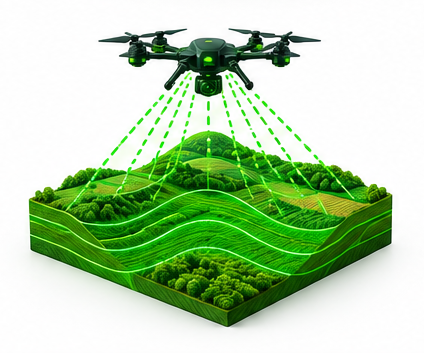
For a researcher, a stressed crop is the start of the question, not the answer. Is it nitrogen or potassium? Water or disease? One variety or another? Drishti Pro is built to answer those questions in the field. Its hyperspectral sensor records a full spectrum of light across up to 180 narrow bands for every pixel, capturing the chemical fingerprint of each plant. A stabilised gimbal, precise georeferencing and built- in calibration turn every flight into clean, comparable scientific data across plots, sites and seasons. Theresult is research-grade insight, collected in hours instead of weeks of manual sampling.
Why hyperspectral
A multispectral camera looks at a crop through a few broad windows of colour — ideal for showing
where a field is healthy and where it is stressed. A hyperspectral camera looks through up to 180 narrow, continuous windows, capturing the complete spectral fingerprint of every plant. That extra detail is what turns a warning into a diagnosis.
|
|
Multispectral camera
|
Drishti Pro hyperspectral
|
|
Spectral bands
|
4–10 broad bands
|
Up to 180 narrow, continuous bands
|
|
Width of each
band
|
Typically 10–40 nm
|
2.5–3.5 nm
|
|
What it tells you
|
Where the crop is
stressed
|
What is causing the stress
|
|
Nutrient analysis
|
Overall crop vigour
|
Separates specific deficiencies, such as nitrogen,
potassium or magnesium
|
|
Disease detection
|
Once stress becomes
visible in vigour
|
Earlier, from subtle changes in leaf chemistry
|
|
Crop, variety and
weed
identification
|
Limited
|
Distinguishes varieties, species and weeds by their
spectral signature
|
|
Data you get
|
Standard vegetation-
index maps
|
A full spectrum for every pixel, ready for custom
indices, classification and AI models
|
|
|
Multispectral camera
|
Drishti Pro hyperspectral
|
|
Spectral bands
|
4–10 broad bands
|
Up to 180 narrow, continuous bands
|
|
Width of each
band
|
Typically 10–40 nm
|
2.5–3.5 nm
|
|
What it tells you
|
Where the crop is
stressed
|
What is causing the stress
|
|
Nutrient analysis
|
Overall crop vigour
|
Separates specific deficiencies, such as nitrogen,
potassium or magnesium
|
|
Disease detection
|
Once stress becomes
visible in vigour
|
Earlier, from subtle changes in leaf chemistry
|
|
Crop, variety and
weed
identification
|
Limited
|
Distinguishes varieties, species and weeds by their
spectral signature
|
|
Data you get
|
Standard vegetation-
index maps
|
A full spectrum for every pixel, ready for custom
indices, classification and AI models
|
Where Drishti Pro works best
- Nutrient diagnosis. Nitrogen, potassium and magnesium deficiencies look alike in a vegetation index; their spectral signatures do not.
- Early disease detection. Fungal and viral infections change leaf chemistry before visible symptoms, and those changes show up in narrow bands.
- Plant breeding and phenotyping. Thousands of plots scored for chlorophyll, water content and pigment traits in a single morning.
- Satellite calibration and crop classification. Field-scale reflectance cubes that validate satellite models and separate crop varieties at scale.
Why Drishti Pro
Drishti finds where a crop is stressed. Drishti Pro tells you why — and for research teams, breeders and product developers, that answer is where real progress begins.
- Full-spectrum insight — up to 180 bands across visible and near-infrared light
- Science-grade data — calibrated to true reflectance, comparable across seasons
- Precise location — every scan line georeferenced to 2 cm
- Clean, steady data — slow, stable survey flights built for hyperspectral imaging
- Ready for analysis — standard data formats that open in common research tools
- Works with Drishti — Drishti scans wide; Drishti Pro studies the flagged zones in depth